The Morning Ritual: Coffee, Spreadsheets, and the Grey Window
It’s 6:30 AM on a Tuesday here in Shanghai. My wife, Yan, is still asleep, and the kettle is boiling for my first cup of Longjing tea. Before I even look at the FTSE 100 futures or my work email, I open a specific app on my phone. It’s a ritual I’ve performed nearly every morning since arriving in China from Manchester in 2015. I’m checking the AQI (Air Quality Index). Being a financial analyst, I live my life in spreadsheets. I track my daily espresso intake, my badminton win/loss ratio, and yes, the particulate matter (PM2.5) count outside my window. Six years ago, this number dictated whether I’d leave the house. Today, in early 2021, it mostly dictates whether I open the window or turn on the Xiaomi air purifier (which, by the way, costs about £140 / 1,299 CNY—a decent investment for clear lungs). My vintage bone china tea cups—a small collection I brought over from the UK—serve as my analog sensor. In the early days, if I left a cup out for an hour near an open window, it would develop a perceptible film of grit. Nowadays, that film is largely gone. But as any analyst knows, anecdotal evidence is dangerous. We need data.
Key Takeaway: While personal observation suggests air quality has improved significantly since 2015, relying on "feeling" isn't enough. We need to look at the hard data from monitoring stations to understand the real trend.
Understanding the Metrics: Don't Panic, Just Prepare
When you first land here, the numbers can be overwhelming. Is 150 bad? Is 300 fatal? I’ve seen newcomers panic over a reading of 90, which, let’s be honest, is just a cloudy Tuesday in London. I use AirVisual for my data, as it aggregates local government stations and the U.S. consulate readings. Here is my personal cheat sheet for surviving the numbers, based on six years of trial, error, and buying too many masks.Tip: Don't obsess over the PM10 (dust/pollen). Focus on PM2.5 (fine particulate matter). That's the stuff that gets into the bloodstream.
My Personal AQI Action Matrix
| AQI Level (US Standard) | My "Manchester Translation" | Required Action | Est. Annual Occurrences (2020) |
|---|---|---|---|
| 0 - 50 | A Crisp Day in the Lake District | Open all windows. Go for a run. | ~30% |
| 51 - 100 | London Underground at Rush Hour | Windows closed. Purifier on "Auto". | ~45% |
| 101 - 150 | Bonfire Night Gone Wrong | Mask optional but recommended for sensitive groups. | ~20% |
| 151 - 200 | The "Beijing Cough" Zone | Mask ON (3M N95). Avoid outdoor sports. | ~4% |
| 200+ | Apocalyptic | Stay inside. Purifiers on "Max". Pray for wind. | < 1% |
Source: Aggregated personal logs correlated with Ministry of Ecology and Environment of the PRC daily reports. Last verified: 2021-02-14
Is the 'Beijing Cough' Still a Thing?
To understand the data, you have to understand the language. When I first visited the capital, I tried to look up beijing in chinese characters to read the local weather reports properly. The character you learn in textbooks for weather is usually 天 (Tiān - Sky) or 气 (Qì - Air). But the character that defined the 2013-2015 era was 霾 (Mái). This specifically refers to smog/haze caused by pollutants, distinct from 雾 (Wù), which is just fog. For years, there was a disconnect between what the U.S. Department of State - Air Quality Monitoring was reporting and what local reports said. The US Embassy in Beijing famously erected a monitor on their roof and started tweeting the data, often labeling days as "Crazy Bad" (a technical term, I'm sure). If you read my post on my first 48 hours in Beijing, you'll know I arrived right as the "War on Pollution" was kicking off. The data shows a massive divergence between 2013 and today. In 2013, Beijing's average PM2.5 was hovering near 90 µg/m³. By 2020, that annual average had dropped to roughly 38 µg/m³. That is a statistical plummet that would make a short-seller weep.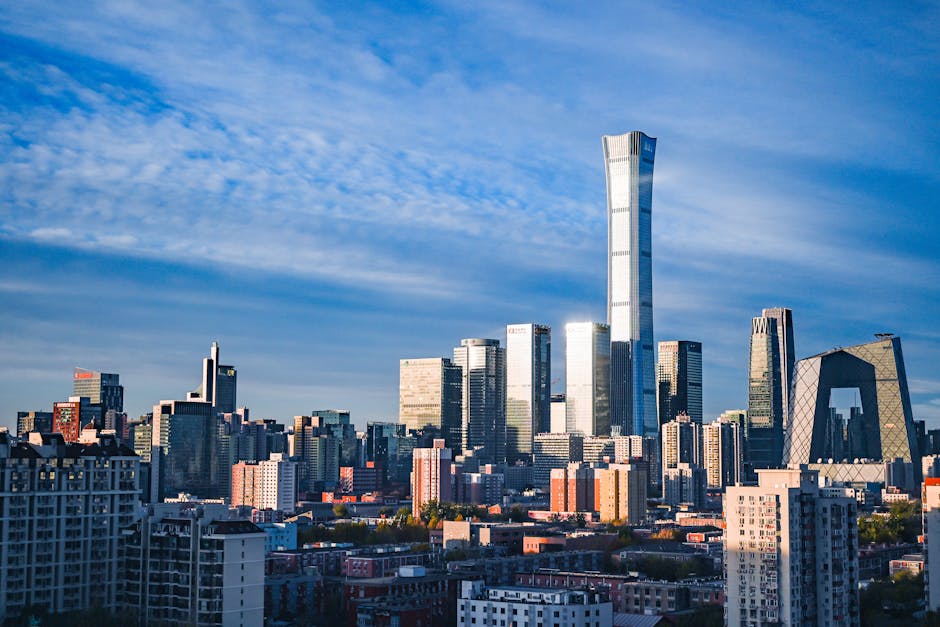
From the Bund to the Airport: Shanghai's Specific Struggle
While Beijing gets the headlines, Shanghai has a different problem. Beijing is dry; Shanghai is wet. When humidity mixes with particulate matter, it creates a sticky haze that lingers. This is where the keyword "China Shanghai Airport" (Pudong International - PVG) triggers PTSD for many business travelers. In financial analysis, we look for correlations. There is a direct correlation between high AQI days in winter and flight delays at PVG. Unlike Beijing, where the strong northern wind can blow the smog away in an hour, Shanghai's maritime climate holds onto it.Flight Delays & Visibility: The Hidden Cost
| Location | Primary Pollution Driver | Impact on Visibility (Flights) | Current Pollution Index |
|---|---|---|---|
| Beijing (PEK/PKX) | Heating (Coal), Industry, Geography | High (Winter), Low (Summer) | 82.41 |
| Shanghai (PVG/SHA) | Shipping, Industry, Vehicle Emissions | Moderate (Year-round due to humidity) | 78.15 |
| Manchester (MAN) | Rain, Rain, and more Rain | Low | 28.50 |
Source: Numbeo Pollution Index. Last verified: 2021-02-14
Tip: If you are booking a flight out of china shanghai airport (PVG) in December or January, book a morning flight. Smog and fog tend to accumulate and worsen visibility by late afternoon/evening, leading to cascading delays.
The Day Mia Was Born: A Personal Timeline of Clearer Skies
My daughter Mia was born here a few years ago. I remember rushing to the hospital, bag packed with essentials (including, naturally, a portable air monitor). It was a crisp autumn day. The AQI was 35. Raising a child here adds a layer of anxiety to the numbers. You aren't just checking for your own comfort; you're checking for developing lungs. However, the anxiety I feel now is significantly lower than the fear I felt for my friends raising kids here in 2016. The government's "Blue Sky Defense War" wasn't just a slogan; it was a fiscal policy. They moved coal-fired plants away from city centers. They switched millions of households from coal heating to gas. They capped vehicle registrations.
The Hard Numbers: A Decade of Environmental Investment
Let’s put away the sentiment and look at the ledger. As an analyst, I follow the money. Where the money goes, the results usually follow. According to data from the National Bureau of Statistics, the investment in the treatment of environmental pollution has been astronomical. We aren't talking about a few million quid; we are talking about trillions of RMB.Investment vs. PM2.5 Levels (2015-2019)
| Year | Inv. in Urban Env. Infrastructure (100M CNY) | Beijing Avg PM2.5 (µg/m³) | Shanghai Avg PM2.5 (µg/m³) | YoY Improvement (Beijing) |
|---|---|---|---|---|
| 2015 (My Arrival) | 4,946.0 (~£549M) | 80.6 | 53.0 | - |
| 2017 | 5,548.0 (~£616M) | 58.0 | 39.0 | -28% improvement |
| 2019 | 6,026.0 (~£669M) | 42.0 | 35.0 | -27% improvement |
| 2020 (Prelim) | Trending Higher 📈 | 38.0 | 32.0 | -9.5% improvement |
Source: Derived from National Bureau of Statistics Annual Data and Ministry of Ecology and Environment reports. Currency conversion approx 1 GBP = 9 CNY. Last verified: 2021-02-14
What the Numbers Don't Tell You (The "Gotchas")
While the average PM2.5 is dropping, Ozone (O3) pollution is actually rising in some areas. The data looks great on the "grey stuff" (particulates), but invisible chemical pollutants are the new challenge. Also, these are averages. An average of 38 doesn't mean you won't have a week in January where the index hits 200+. It just means the "Airpocalypse" days are now outliers rather than the norm.A Timeline of Breathing: 2015 to 2021
Looking back at my six years here, the trajectory is undeniable. 2015: I arrived with a suitcase full of 3M masks. I wore them every other day. I checked the app obsessively. 2017: The "coal-to-gas" transition caused some heating issues in the north, but the skies were noticeably bluer. 2019: I stopped wearing masks for pollution (though I wore them for other reasons in 2020, obviously). I started playing badminton outdoors again. 2021: I still check the app. I still filter my water (old habits die hard). But I no longer plan my week around the smog forecast. The data supports what my dusty tea cups told me: the air is cleaning up. It’s not the Swiss Alps, and it certainly isn't the rainy freshness of Manchester, but for a developing megacity, the turnaround is one of the most impressive statistical corrections I've ever seen. Now, if you’ll excuse me, the AQI is currently 42. I’m going for a run.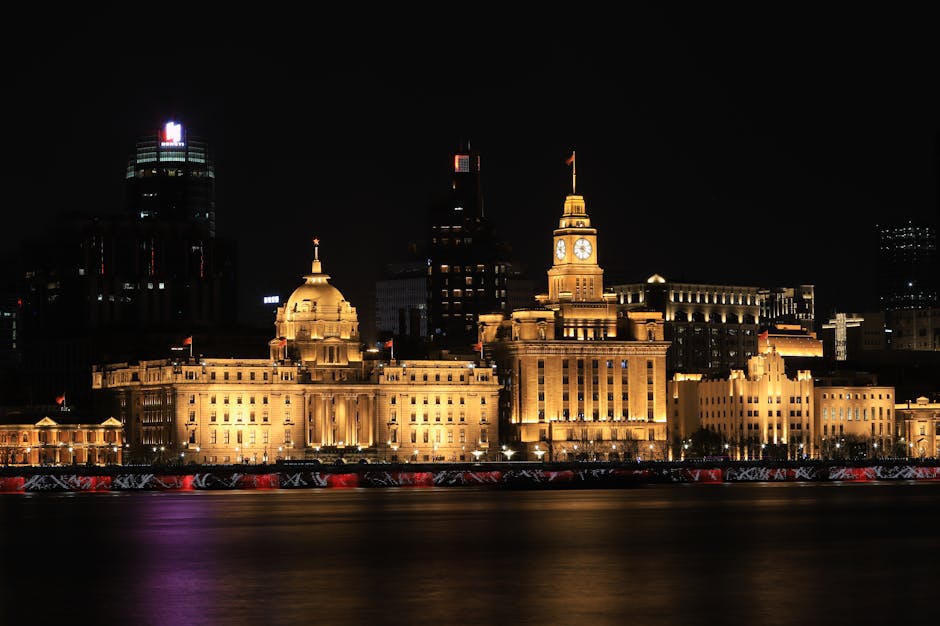
Comments
Comments are currently closed. Have feedback or a question? Reach out through the contact info on the About page.